project
BTC/USD Cross-Venue Price Discovery
Coinbase vs Kraken Market Microstructure and Econometric Price Discovery
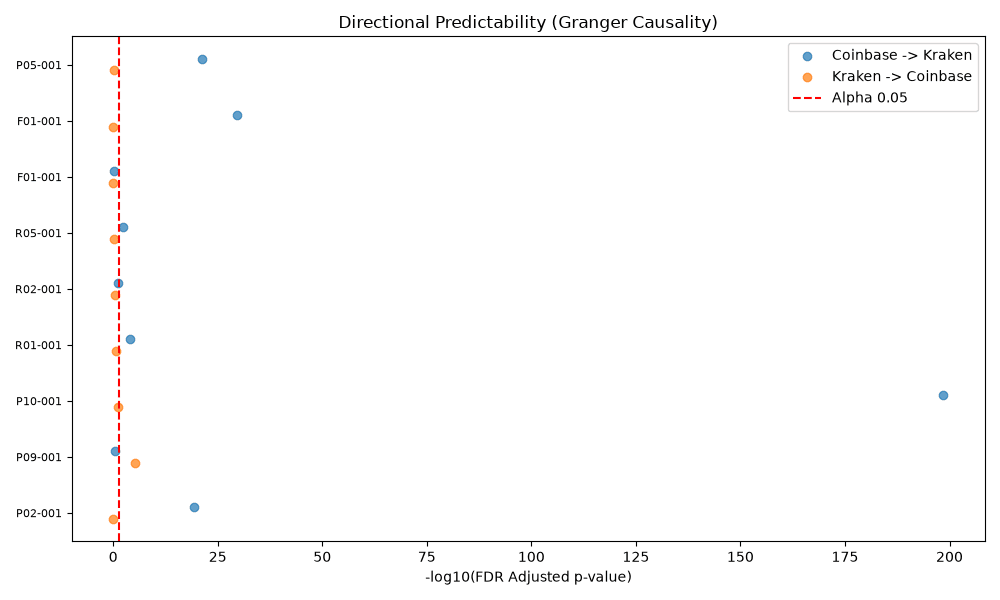
resultAcross 9 econometrically usable paired sessions, Coinbase showed stronger short-horizon price leadership over Kraken: BH-significant Granger evidence appeared in 6/9 sessions Coinbase → Kraken versus 1/9 in the reverse direction.
A confirmatory empirical study of BTC/USD price discovery across Coinbase and Kraken using synchronized market data, VAR/VECM models, Granger causality, predictive regressions, impulse responses, Gonzalo–Granger component shares, and Hasbrouck information-share bounds. The evidence favors stronger Coinbase short-horizon leadership, while long-run price discovery remains heterogeneous across sessions.
Where does information enter the BTC/USD market first?
Visual snapshot
- accepted paired sessions
- 10
- econometrically usable sessions
- 9
- calendar dates
- 6
- authoritative paired overlap
- 18,571.37 s
- BH-significant Granger CB → KR
- 6/9
- BH-significant Granger KR → CB
- 1/9
Summary of the confirmatory econometric sample. One accepted session was not econometrically usable: its longest contiguous synchronized segment (295 observations) was below the pre-specified minimum of 300.
Problem
Does Coinbase or Kraken lead BTC/USD price discovery, and is that leadership stable across sessions? The question separates into three parts: short-horizon directional predictability, dynamic shock transmission, and long-run price discovery.
I collected synchronized Coinbase and Kraken market data across multiple paired sessions and built a confirmatory econometric pipeline to distinguish short-horizon directional predictability from long-run price discovery.
The resulting evidence is asymmetric but not absolute: Coinbase exhibits stronger and more persistent short-horizon leadership over Kraken, while long-run leadership varies meaningfully across sessions.
Approach
The study uses 10 accepted paired Coinbase and Kraken BTC/USD sessions across 6 calendar dates, totaling 18,571.366221 seconds of authoritative paired overlap and 18,528.188261 seconds of empirical trade overlap. One session was excluded from econometric inference because its longest contiguous synchronized segment (295 observations) was below the pre-specified minimum sample requirement of 300.
Baseline synchronization used 100 ms sampling, a 2,000 ms stale quote threshold, gap-safe contiguous samples, no lookahead, and rejection of negative quote ages and stale accepted quotes. A strict 50 ms freshness robustness check accepted only approximately 3.64% of observations versus approximately 81.56% under baseline, providing evidence that the baseline was not accidentally operating under a hidden 50 ms freshness rule.
Short-horizon finding
The clearest result is asymmetric short-horizon predictability. Coinbase → Kraken Granger causality was individually significant after Benjamini–Hochberg correction in 6 of 9 usable sessions, compared with 1 of 9 for Kraken → Coinbase.
The aggregate predictive regression also supported Coinbase → Kraken transmission, while the reverse aggregate predictive effect was not significant at the 5% level.
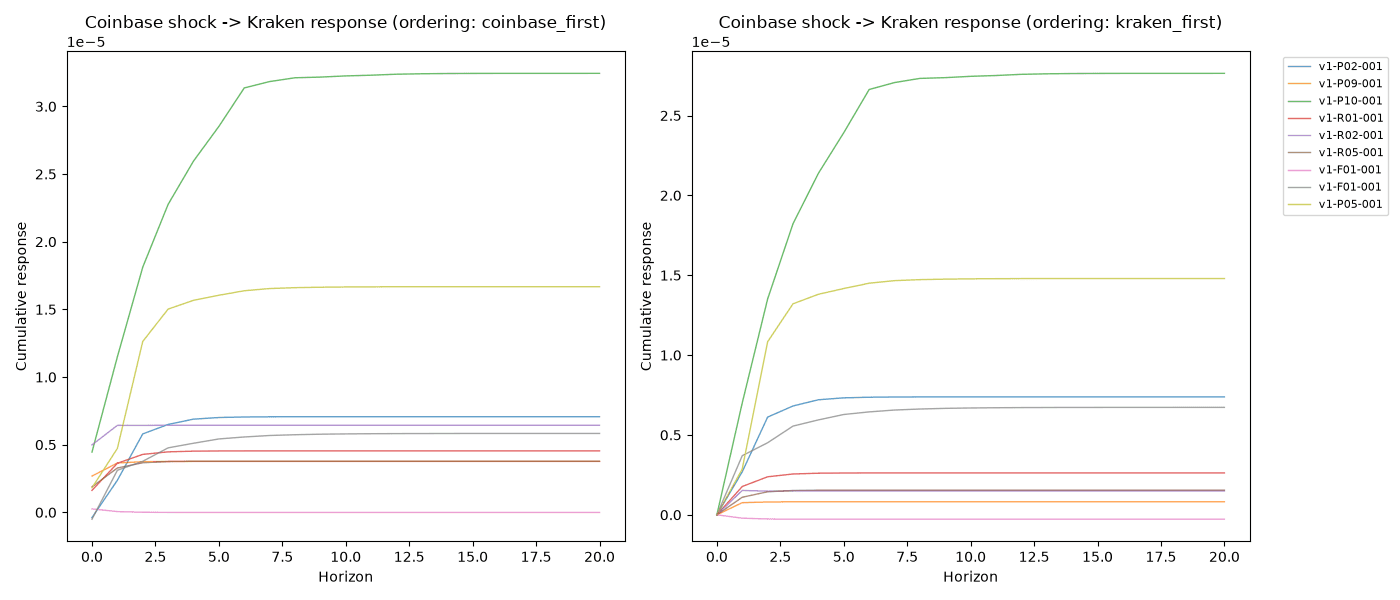
For a fixed economic Coinbase price shock, the terminal Coinbase → Kraken impulse response was positive in 8 of 9 usable sessions under both Cholesky orderings.
This supports stronger and more persistent short-horizon Coinbase leadership without implying that Kraken never contributes information.
- BH-significant Granger CB → KR: 6/9 usable sessions
- BH-significant Granger KR → CB: 1/9 usable sessions
- Aggregate HAC predictive regression CB → KR: significant
- Aggregate HAC predictive regression KR → CB: not significant at 5%
- Positive terminal impulse response CB → KR: 8/9 usable sessions under both orderings
Result visualizations
Technical pipeline
- ADF stationarity diagnostics
- Johansen cointegration testing
- VAR with BIC lag selection
- VECM where cointegration rank = 1
- Bidirectional Granger causality
- Benjamini–Hochberg multiple-testing correction
- Newey–West / HAC predictive regressions
- Orthogonalized impulse responses under both Coinbase-first and Kraken-first Cholesky orderings
- Gonzalo–Granger component shares
- Hasbrouck information-share bounds
- Fisher aggregation across sessions
- Equal-attempt weighting
Result at a glance
What failed or changed
One accepted session was not econometrically usable because its longest contiguous synchronized segment was 295 observations, below the frozen minimum of 300. The exclusion was not discretionary.
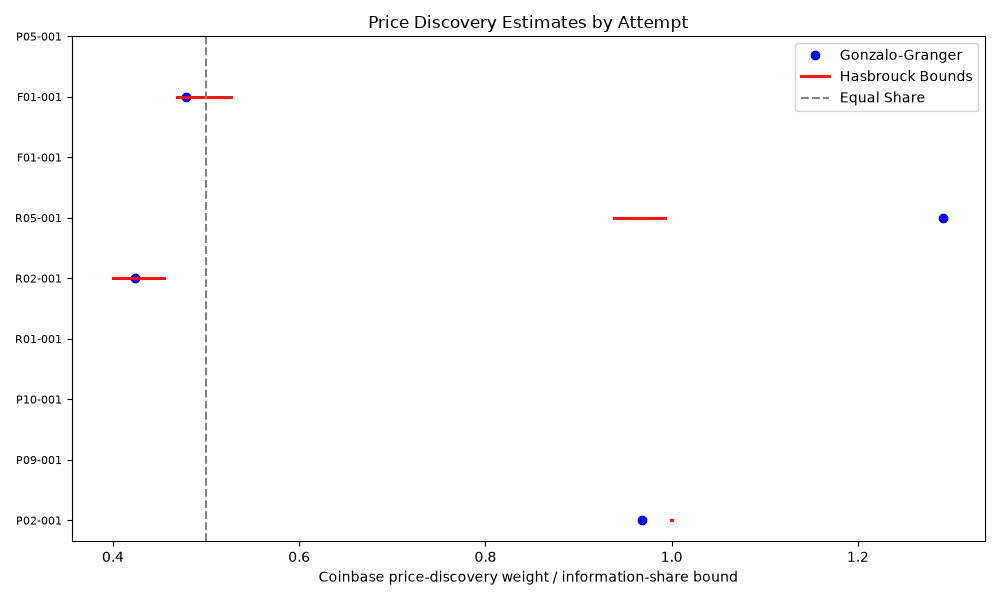
Cointegration rank varied substantially across sessions: rank 0 in 2 sessions, rank 1 in 4, rank 2 in 3. Long-run price leadership was therefore not structurally fixed.
Long-run Gonzalo–Granger and Hasbrouck measures were reported only for the four rank-1 sessions. Those four sessions did not support a single permanent venue leader: some strongly favored Coinbase, while others showed roughly balanced or Kraken-leaning component shares.
Strict quote-freshness robustness dramatically reduced sample acceptance (3.64% vs 81.56% baseline), confirming the baseline design was not accidentally narrow.
Not every reverse-direction Kraken → Coinbase effect disappeared; feedback existed in isolated periods. The study therefore rejected a simplistic “Coinbase always leads” conclusion.
Final interpretation
Coinbase exhibits stronger and more persistent short-horizon price leadership over Kraken, while feedback from Kraken to Coinbase exists in isolated periods. Long-run price-discovery leadership is heterogeneous across sessions rather than structurally fixed.
This is not equivalent to saying Coinbase always leads Kraken or dominates BTC price discovery. The evidence supports asymmetric short-horizon leadership only.
Limitations
- Public WebSocket data only; no private order flow.
- 100 ms baseline synchronization; sub-millisecond latency not measured.
- Long-run decompositions reported only for rank-1 sessions.
- Cointegration rank was not uniform across sessions.
- Hasbrouck bounds, not point estimates, are used for information shares.
- Strict freshness robustness reduced sample acceptance to 3.64%, so the baseline result should not be interpreted as a 50 ms freshness rule.
- No predictive model, backtest, execution simulation, PnL result, or live trading system.
- Raw market data is not committed to the public repository.
How to reproduce
The public repository includes deterministic analysis configuration, validated normalized data snapshots, artifact hashes, source/result provenance, automated econometric reporting, unit tests, static typing, linting/format validation, GitHub Actions CI, and a public v1.0.0 release.
Raw market data is intentionally excluded from the repository. The final generated result bundle, including the econometric report, result tables, and figures, is publicly tracked.